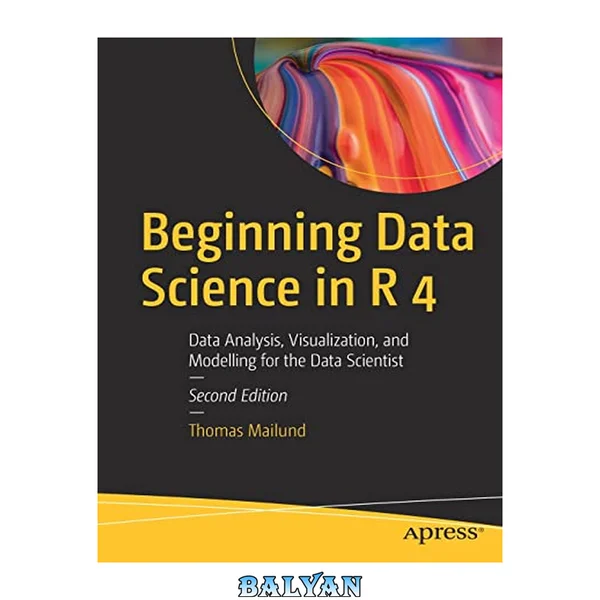
“We live in the age of data. In the last few years, the methodology of extracting insights from data or "data science" has emerged as a discipline in its own right. The R programming language has become one-stop solution for all types of data analysis. The growing popularity of R is due its statistical roots and a vast open source package library. The goal of “Beginning Data Science with R” is to introduce the readers to some of the useful data science techniques and their implementation with the R programming language. The book attempts to strike a balance between the how: specific processes and methodologies, and understanding the why: going over the intuition behind how a particular technique works, so that the reader can apply it to the problem at hand. This book will be useful for readers who are not familiar with statistics and the R programming language. 4.4 Interactive Visualizations using Shiny 4.5 Chapter Summary & Further Reading References 5 Exploratory Data Analysis 5.1 Summary Statistics 5.1.1 Dataset Size 5.1.2 Summarizing the Data 5.1.3 Ordering Data by a Variable 5.1.4 Group and Split Data by a Variable 5.1.5 Variable Correlation 5.2 Getting a sense of data distribution 5.2.1 Box plots 5.2.2 Histograms 5.2.3 Measuring Data Symmetry using Skewness and Kurtosis 5.3 Putting it all together: Outlier Detection 5.4 Chapter Summary References 6 Regression 6.1 Introduction 6.1.1 Regression Models 6.2 Parametric Regression Models 6.2.1 Simple Linear Regression 6.2.2 Multivariate Linear Regression 6.2.3 Log-Linear Regression Models 6.3 Non-Parametric Regression Models 6.3.1 Locally Weighted Regression 6.3.2 Kernel Regression 6.3.3 Regression Trees 6.4 Chapter Summary References 7 Classification 7.1 Introduction 7.1.1 Training and Test Datasets 7.2 Parametric Classification Models 7.2.1 Naive Bayes 7.2.2 Logistic Regression 7.2.3 Support Vector Machines 7.3 Non-Parametric Classification Models 7.3.1 Nearest Neighbors 7.3.2 Decision Trees 7.4 Chapter Summary References 8 Text Mining 8.1 Introduction 8.2 Reading Text Input Data 8.3 Common Text Preprocessing Tasks 8.3.1 Stop Word Removal 8.3.2 Stemming 8.4 Term Document Matrix 8.4.1 TF-IDF Weighting Function 8.5 Text Mining Applications 8.5.1 Frequency Analysis 8.5.2 Text Classification 8.6 Chapter Summary Deals With Implementing Many Useful Data Analysis Methodologies With The R Programming Language. The Target Audience ... Is Non-r Programmers And Non-statisticians. The Book Will Cover All The Necessary Concepts From The Basics To State-of-the-art Technologies Like Working With Big Data. The Author Attempts To Strike A Balance Between The 'how' : Specific Processes And Methodologies, While Also Talking About The 'why' : Giving An Intuition Behind How A Particular Technique Works, So That The Reader Can Apply The Generalized Solution To The Problem At Hand.--back Cover. Manas A. Pathak. Includes Bibliographical References. 4.3.2 ggplot(): Specifying the Grammar of the Visualization4.3.3 Themes; 4.4 Interactive Visualizations Using Shiny; 4.5 Chapter Summary and Further Reading; References; Chapter 5 Exploratory Data Analysis; 5.1 Summary Statistics; 5.1.1 Dataset Size; 5.1.2 Summarizing the Data; 5.1.3 Ordering Data by a Variable; 5.1.4 Group and Split Data by a Variable; 5.1.5 Variable Correlation; 5.2 Getting a Sense of Data Distribution; 5.2.1 Box Plots; 5.2.2 Histograms; 5.2.3 Measuring Data Symmetry Using Skewness and Kurtosis; 5.3 Putting It All Together: Outlier Detection; 5.4 Chapter Summary; References 7.2 Parametric Classification Models7.2.1 Naive Bayes; 7.2.1.1 Training an NB Classifier Using the e1071 Package; 7.2.2 Logistic Regression; 7.2.2.1 Using the glm() Function; 7.2.3 Support Vector Machines; 7.2.3.1 Kernel Trick; 7.3 Nonparametric Classification Models; 7.3.1 Nearest Neighbors; 7.3.2 Decision Trees; 7.4 Chapter Summary; References; Chapter 8 Text Mining; 8.1 Introduction; 8.2 Dataset; 8.3 Reading Text Input Data; 8.4 Common Text Preprocessing Tasks; 8.4.1 Stop Word Removal; 8.4.2 Stemming; 8.5 Term Document Matrix; 8.5.1 TF-IDF Weighting Function; 8.6 Text Mining Applications “Data Science with R” deals with implementing many useful data analysis methodologies with the R programming language. The target audience for this book is non-R programmers and non-statisticians. The book will cover all the necessary concepts from the basics to state-of-the-art technologies like working with big data. The author attempts to strike a balance between the “how”: specific processes and methodologies, while also talking about the “why”: giving an intuition behind how a particular technique works, so that the reader can apply the generalized solution to the problem at hand. ZData Science with Ry deals with implementing many useful data analysis methodologies with the R programming language. The target audience for this book is non-R programmers and non-statisticians. The book will cover all the necessary concepts from the basics to state-of-the-art technologies like working with big data. The author attempts to strike a balance between the zhowy: specific processes and methodologies, while also talking about the zwhyy: giving an intuition behind how a particular technique works, so that the reader can apply the generalized solution to the problem at hand Preface; Goal of this Book; Prerequisites; Contents; Chapter 1 Introduction; 1.1 What Is Data Science?; 1.2 Why R?; 1.3 Goal of This Book; 1.4 Book Overview; References; Chapter 2 Overview of the R Programming Language; 2.1 Installing R; 2.1.1 Development Tools; 2.2 R Programming Language; 2.2.1 Operators; 2.2.2 Printing Values; 2.2.3 Basic Data Types; 2.2.4 Control Structures; 2.2.5 Functions; 2.3 Packages; 2.3.1 R Help System; 2.4 Running R Code; Reference; Chapter 3 Getting Data into R; 3.1 Reading Data; 3.1.1 Text Files; 3.1.1.1 Data Frames; 3.1.1.2 Reading Data from Databases 3.2 Cleaning Up Data3.2.1 Identifying Data Types; 3.2.2 Data Entry Errors; 3.2.3 Missing Values; 3.3 Chapter Summary; References; Chapter 4 Data Visualization; 4.1 Introduction; 4.2 Basic Visualizations; 4.2.1 Scatterplots; 4.2.1.1 Labeling Data Points; 4.2.1.2 Points and Lines; 4.2.2 Visualizing Aggregate Values with Bar plots and Pie charts; 4.2.2.1 Group Data by a Variable; 4.2.2.2 Bar Plots; 4.2.2.3 Pie Charts; 4.2.3 Common Plotting Tasks; 4.2.3.1 Multiple Plots; 4.2.3.2 Saving Plots to Files; 4.3 Layered Visualizations Using ggplot2; 4.3.1 Creating Plots Using qplot() Chapter 6 Regression6.1 Introduction; 6.1.1 Regression Models; 6.2 Parametric Regression Models; 6.2.1 Simple Linear Regression; 6.2.1.1 Model Fitting Using lm(); 6.2.1.2 Modeling Categorical Variables; 6.2.1.3 Model Diagnostics; 6.2.1.4 Model Prediction Using Predict(); 6.2.2 Multivariate Linear Regression; 6.2.3 Log-Linear Regression Models; 6.3 Nonparametric Regression Models; 6.3.1 Locally Weighted Regression; 6.3.2 Kernel Regression; 6.3.3 Regression Trees; 6.4 Chapter Summary; References; Chapter 7 Classification; 7.1 Introduction; 7.1.1 Training and Test Datasets